|
Electron Tomography - Overview
adapted from:
Hall, Hartwieg and Nguyen
Hall and Rice
doi:10.3908/wormatlas.9.17
Overview
While transmission electron microscopy (TEM) has been applied to C. elegans for over 45 years and has yielded many important results (White et al., 1986; Jarrell et al., 2012), TEM has its limits, particularly for smaller items that are near the dimensions of a thin section. Objects such as synaptic vesicles, microtubules or actin (5-50 nm range and below) become hidden due to overlap with other nearby objects and become difficult to resolve separately or to quantify, and details of their local interactions are lost from view.
Electron tomography (ET) offers an elegant solution to this quandary, with a local resolution of roughly 10 nm in any dimension when solving for structure, and perhaps 5 nm resolution when solving for molecular details in cryo-ET where fast frozen samples are prepared without embedment or heavy staining (Leis et al., 2008). Electron tomography was first developed several decades ago, and has gradually become much more accessible as computational methods and programmable microscopes have proliferated (Franck, 2006) and now is becoming one of the leading EM techniques for C. elegans. Modern electron microscopes now come equipped with a highly stable tilting stage (the goniometer), high quality CCD camera and powerful analytical software for the creation and annotation of 3D tomograms (Franck, 2006), all of which help make ET image collection almost routine. Additionally, the technique has benefited from modern advances in tissue preparation methods, such as high pressure freezing (HPF) and freeze substitution (FS) (McDonald, 1994; McDonald and Webb, 2011; Hall et al., 2012; Müller-Reichert et al., 2003), which allow more accurate preservation of ultrastructure than had been originally available. Work with fast frozen animals in the absence of plastic embedment remains very difficult, but again ET can help to define the exact shapes of smaller structures, even where low contrast makes individual micrographs appear almost blank (Leis et al., 2008; Iancu et al., 2007; Irobalieva et al., 2016). Just as the nematode seems to be ideally suited for the high-pressure freezing technique due to its small size, the nematode is also well suited for electron tomography due to its simplicity and the wealth of anatomic information already available.
Electron tomography techniques were pioneered for intact C. elegans by John White, Thomas Müller-Reichert, Richard McIntosh, Kent McDonald, and their colleagues. Early objects of interest have included the mitotic spindle in the early embryo (OToole et al., 2003; OToole and Müller-Reichert, 2008; Pelletier et al., 2006; Redemann et al., 2017), the ultrastructure of the mitochondrion (Kanazawa et al., 2008), the cilium (Nechipurenko et al., 2017; Serwas and Dammermann, 2015; Serwas et al., 2017; Silva et al., 2017), and the shape and organization of ribosomes in the rough endoplasmic reticulum (Leapman et al., 2004). The Hall lab was introduced to this technology through the auspices of the New York Structural Biology Center, with technical help from KD Derr and William Rice. Many subcellular structures within C. elegans are immediately of interest in both wild type and mutant backgrounds, such as intercellular junctions, synapses, sensory endings, and apical structures at the luminal border of the intestine (Stigloher et al., 2011; Topalidou et al., 2012, König et al., 2017).
TEM studies of the nematode have been impeded by the animal’s thick cuticle, which slows down access to fixatives, heavy metal stains, or plastic resins (White et al., 1986; Jarrell et al., 2012; Ward et al., 1975; Ware et al., 1975). Details in these pioneering studies suffered from uneven embedment and heavy stain artifacts that made it difficult to achieve uniform results. With the advent of HPF/FS and wider access to microscopes with programmed goniometer stages, the physical barriers to ET have dropped away. Animals preserved by HPF followed by freeze substitution provide the ideal specimens for electron tomography. It is also possible to collect frozen thin sections to be viewed on a cryo-stage within the TEM, without thawing or plastic embedment. This is useful for 3D studies of molecular complexes. Fine details of isolated molecular complexes can also be viewed by electron tomography after spreading them on thin films (Ben-Harush et al., 2009). Alternately, intact fast frozen tissue can be embedded in plastic for viewing in semi-thin sections (80500 nm thick). In the latter case, the limits on viewing may depend on the strength of the electron beam needed to penetrate through the section at higher tilt angles.
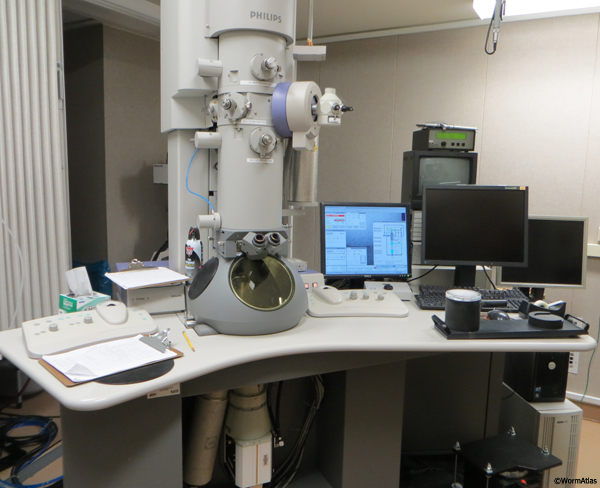
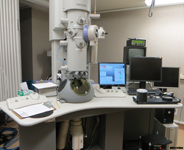
TEMs with a field emission gun (FEG) offer higher power electrons for use with thicker specimens (from 200 kV up to three million kV). The examples shown below were produced on an FEI Tecnai20 electron microscope equipped using a 200 kV FEG, viewing sections at thicknesses from 80 to 250 nm (ETFIG 1).
 ETFIG 1 ETFIG 1
The SerialEM program was used to control the microscope stages X,Y position, the degree of tilt, and the exact focus, collecting and organizing about 100 sequential EM images while the stage is gradually tilted from 70° to + 70° (Mastronarde, 2005). The sequential images were then processed using the protomo software package to create the initial tomogram (Winkler and Taylor, 2006). For some applications, the semi-thin sections may be coated with gold beads on one side as alignment markers in calibrating the exact relations between all objects within the tilt series for tomogram production (Franck, 2006) (ETFIG 2). In other cases, information based upon structural features inherent inside the tissue itself (e.g., markerless alignment) has proven sufficient to provide weighted back projections in 3D space (ETFIG 3).
 ETFIG 2 ETFIG 2  ETFIG 3 ETFIG 3
Using Fourier transforms to compare objects from hundreds of different angled views through the same semi-thick section, it becomes possible to separately resolve microscopic details even when some objects lie behind one another within the EM section. One begins by collecting many images around one or two axes of tilt for a single image space, then computing a tomographic reconstruction for each tilt axis, and combining those single axis tomograms into a dual axis tomogram having even higher resolution (ETFIG 2 and ETFIG 3) (Franck, 2006). The ultimate limits on resolution can be difficult to measure exactly, and may be subject to both specimen quality and total scope magnification. However, this technology allows one to achieve much better views of objects in the 330 nm size range (smaller than the typical thin section thickness) that were previously obscure in single sections. Furthermore, by combining tomograms across serial sections, one can also build accurate 3D models of larger volumes that are large enough to reconstruct whole organelles or perhaps
even whole cells in exacting detail. The precision of these models exceeds any previous 3D model based upon standard thin section reconstructions.
A dual tilt tomogram from one semi-thick section consists of a data model that can be viewed with the appropriate software from multiple angles, allowing identification and annotation of structures within the three-dimensional volume. The McIntosh laboratory at Boulder has produced free software called IMOD that is very useful for several key steps in data analysis (ETFIG 4 and ETFIG 5) (Kremer et al., 1996). Several commercial annotation packages are also available, including Amira and Maya (see Computer based tools). After annotation, the 3dmod module of IMOD provides only a limited roster of visualization tools to display the model. For that reason, we have been moving the annotated 3dmod models into Amira (see WormAtlas Movie Gallery). Other available visualization packages include Blender and Cinema 4D. The 3dmod module allows one to draw objects in multiple colors, to model objects as lines, spheres, or to trace open or closed contours having more complex shapes (ETFIG 5 and ETFIG 6). Better tools are still needed for modeling more diffuse features, such as networks of fine filaments (basal lamina, terminal web, actin networks, etc), or to allow edges of objects to be defined accurately by thresholding. Properties of the electron tomogram data (noisiness, poor contrast) make these diffuse features difficult to address at present.
 ETFIG 4 ETFIG 4
 ETFIG 5 ETFIG 5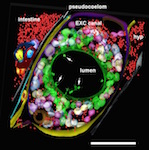 ETFIG 6 ETFIG 6
Helpful Hints
Special TEM specimen holders are necessary in order to collect images up to very high tilt angles (+/–70°) for tomography. Going to extremely high tilts reduces the ‘‘missing wedge’’ of data space for Fourier analysis and improves final resolution.
The IMOD program can be difficult to learn, but this program is widely used, and new features are still being added and improved. The program is supplied as freeware from the University of Colorado in Boulder. An online user group is available to answer questions and there are several on-line tutorials.
Troubleshooting
One of the exciting features of electron tomography is that one may begin to visualize objects that were not apparent in any standard TEM view, while looking ‘‘live’’ on the microscope. This means that finding the features of interest is not always straight forward, and it will be worthwhile to try several places in the search for the ‘‘right’’ locale. But one must also be very careful not to spend any time viewing poorly frozen tissues, since any freeze damage will only make bigger problems in interpretation as one moves from standard TEM images to tomograms.
Figures
 Click pictures for new window with figure and legend, click again for high resolution image Click pictures for new window with figure and legend, click again for high resolution image
ETFIG 1: Philips Technai 20 transmission electron microscope is used for electron tomography. This microscope (available from FEI, Portland, OR) has an excellent tilting goniometer to control views of the sample at many angles, and a bottom-mounted digital camera for data collection. The microscope can be programmed to collect images for many hours automatically, achieving the correct focus, magnification, tilt, and image framing on its own, and by comparison to previously collected images.
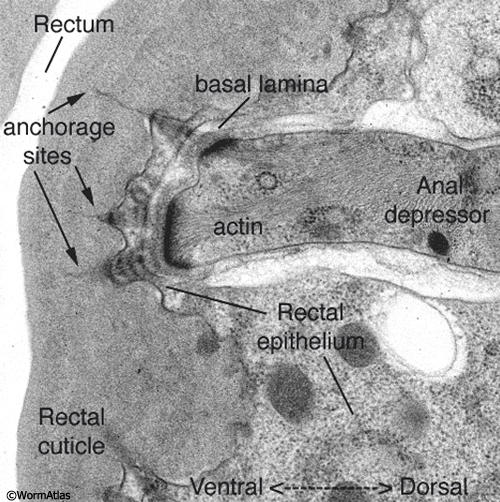
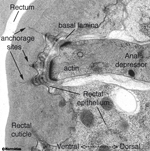
ETFIG 2: Electron tomogram of a rectal muscle. A dual axis electron tomogram shows diffuse elements of the basal lamina and within the cuticle, including layers of filaments spanning the lamina, and long thin filaments anchoring the depressor muscle cell to the rectal cuticle. Ventral is to the left. This is not an electron micrograph. The tomogram has been resliced at a favorable angle. Such fine features are never seen well in standard thin sections. HPF/FS sample. Image capture by Leslie Gunther, FEI Technai20 TEM. Tomogram calculated using gold particles as reference marks. This tomogram can also be viewed as a set of movies.
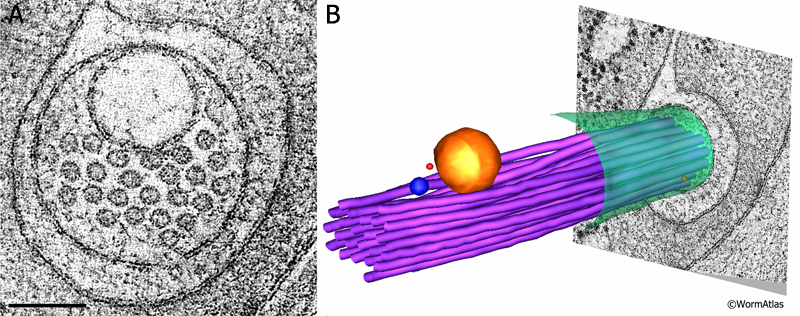
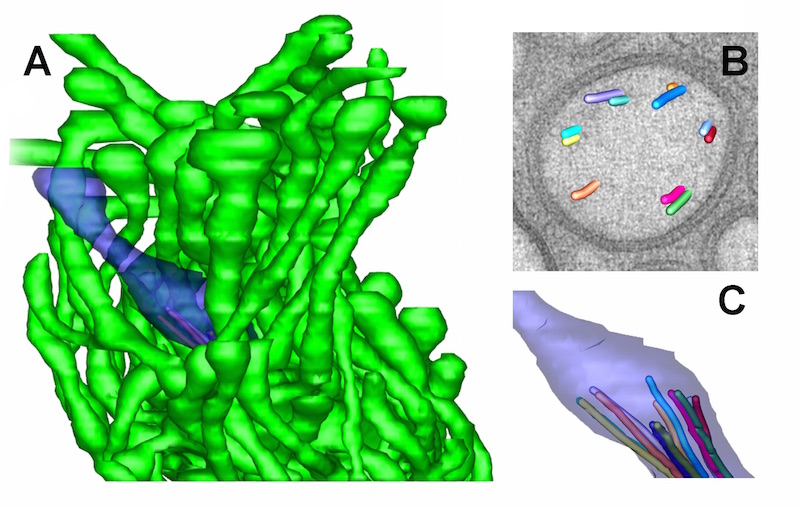
ETFIG 3: Electron tomogram of a touch dendrite. A. Raw image of ALM dendrite within the dual axis electron tomogram, face on, prior to any annotation. This is a mathematical model built after Fourier analysis, not a micrograph. Note that the microtubules are clustered near a large vesicle, which is likely cargo to be moved by microtubule-based motors inside the dendrite. HPF/FS sample. Image capture by KD Derr (NYSBC), Technai20 TEM. Tomogram calculated using weighted back projection from internal features by Bill Rice (NYSBC). Scale bar, 100 nm. B. Hand-annotated elements of the ALM dendrite and its neighborhood. Note that the microtubule bundle bends to accommodate passage of the vesicle. Purple, microtubules; red, ribosomes; yellow, large vesicle; blue, small vesicle; green, ALM plasma membrane. IMOD annotation by Kristin Politi (see Topalidou et al., 2012). This tomogram can also be viewed as a movie.
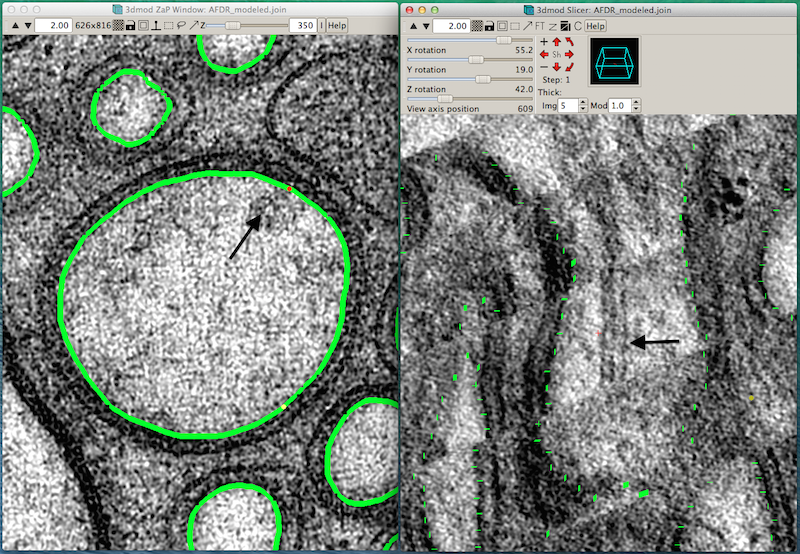
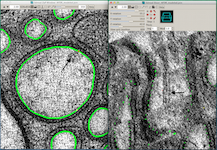
ETFIG 4: IMOD window with two views for annotation.
Sample working space in IMOD in which two projection planes of the same object can be seen at different angles to one another. Left panel. Distal dendrite of AFD is seen in “orthoslice” 350, with the main branches traced in green. Right panel. Same region is seen almost lengthwise, with faint green highlights marking outlines of cell processes. Arrows in each panel indicate the same object, a doublet microtubule. Tissue annotation by Emily Semaya.
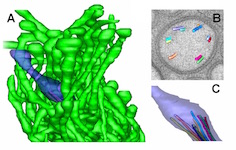
ETFIG 5: 3D model of AFD ending. A. Complex neuron ending of the AFD neuron include one short cilium (purple) and multiple microvilli (green) emerging from the dendrite tip. From a tomogram covering 15 serial sections. Scale bar is one micron. B. Closer view at the base of the cilium, where microtubules are shown extruding from one slice through the tomogram. Microtubules organize as doublets here, with almost no singlet microtubules extending distally beyond the axoneme. C. Individual microtubules of the cilium axoneme are modeled, showing that they all stop short, and do not enter the distal tip of the cilium. Microscopy conducted by Ken Nguyen and Willisa Liou. Tissue model created in IMOD by Emily Semaya.
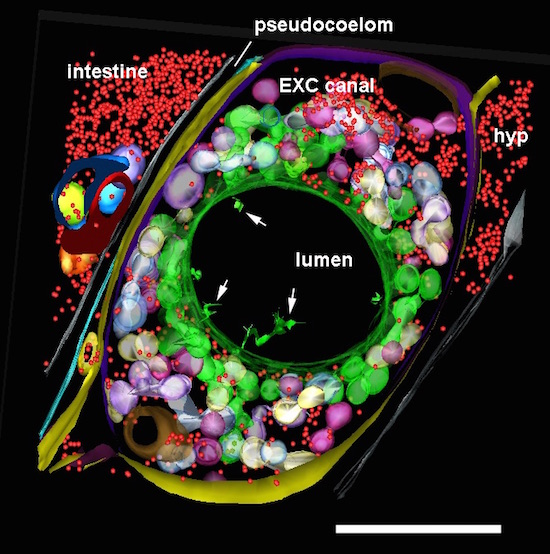
ETFIG 6: Annotated adult excretory canal. The complex physical relationships between the internal organelles of the excretory canal have been modeled within three semi-thin serial sections in a dual axis tomogram (cf. Khan et al., 2013). Despite the rather crowded nature of this tissue, the relationships among many smaller objects become much more visible in the tomogram compared to 50 nm thin sections, and simpler to annotate compared to a stack of serial TEM micrographs. Some features have only become apparent in the tomogram, such as the filamentous structures in the lumen (white arrows). Ribosomes, red; bead-like canaliculi, green, white and violet; outer plasma membrane of canal cell, yellow and purple; plasma membrane apposed to inner lumen, green. Nearby tissues include the hypodermis (hyp), intestine, and an expansion of the extracellular space, the pseudocoelom. Scale bar is one micron. Microscopy conducted by Ken Nguyen. Tissue model created in IMOD by Ashleigh Bouchelion.
References
Ben-Harush, K., Wiesel, N., Frenkiel-Krispin, D., Moeller, D., Soreq, E., Aebi, U., Herrmann, H., Medalia, O., Collins, F.S. and Goldman, A.E. 2009. The supramolecular organization of the C. elegans nuclear lamin filament. J. Mol. Biol. 386: 13921402. Abstract
Franck, J. 2006. Electron Tomography: Methods for the Three-Dimensional Visualization of Structure in the Cell, 2nd Edition. Springer, Berlin, p. 455. Abstract
Hall, D.H. and Rice, W.J. 2015. Electron tomography mehtods for C. elegans. Methods Mol. Biol. 1327: 141-58. Abstract
Hall, D.H., Hartweig, E. and Nguyen, K.C.Q. 2012. Modern electron microscopy methods for C. elegans. Methods Cell Biol. 107: 93-149. Abstract
Iancu, C.V., Tivol, W.F., Schooler, J.B., Dias, D.P., Henderson, G.P., Murphy, G.E., Wright, E.R., Li, Z., Yu, Z., Briegel, A., Gan, L., He, Y. and Jensen, G.J. 2007. Electron cryotomography sample preparation using the Vitrobot. Nature Prot. 1: 2813-2819. Abstract
Irobalieva, R.N., Martins, B. and Medalia, O. 2016. Cellular structural biology as revealed by cryo-electron tomography. J. Cell Sci. 129: 469-76. doi: 10.1242/jcs.171967. Article
Jarrell, T.A., Wang, Y., Bloniarz, A.E., Brittin, C.A., Xu, M., Thomson, J.N., Albertson, D.G., Hall, D.H. and Emmons, S.W. 2012. The connectome of a decision making neuronal network. Science 337: 437-444. Abstract
Kaltdorf, K.V., Schulze, K., Helmprobst, F., Kollmannsberger, P., Dandekar, T., Stigloher, C. 2017. FIJI Macro 3D ART VeSElecT: 3D automated reconstruction tool for vesicle structures of electron tomograms. PLoS Comput. Biol. 13: e1005317. doi: 10.1371/journal.pcbi.1005317. Article
Kanazawa, T., Zappaterra, M.D., Hasegawa, A., Wright, A.P., Newman-Smith, E.D., Buttle, K.F., McDonald, K., Mannella, C.A. and van der Bliek, A.M. 2008. The C. elegans Opa1 homologue EAT3 is essential for resistance to free radicals. PLoS Genet. 4: e1000022. Article
Knig, J., Frankel, E.B., Audhya, A. and Mller-Reichert T. 2017. Membrane remodeling during embryonic abscission in C. elegans. J. Cell Biol. 216: 1277-1286. doi: 10.1083/jcb.201607030. Abstract
Kremer, J.R., Mastronarde, D.N. and McIntosh, J.R. 1996. Computer Visualization of Three-Dimensional Image Data Using IMOD. J. Struct. Biol. 116: 7176. Abstract
Leapman, R.D., Kocsis, E., Zhang, G., Talbot, T.L. and Laquerriere, P. 2004. Three-dimensional distributions of elements in biological samples by energy-filtered electron tomography. Ultramicroscopy 100: 115125. Abstract
Leis, A., Rockel, B., Andrees, L. and Baumeister, W. 2008. Visualizing cells at the nanoscale. Trends Biochem. Sci. 34: 60-70. Abstract
Mastronarde, D.N. 2005. Automated electron microscope tomography using robust prediction of specimen movements. J. Struct. Biol. 152: 3651. Abstract
McDonald, K.L. 1994. Electron microscopy and EM immunocytochemistry. Meth. Cell Biol. 44: 411–444. Abstract
McDonald, K.L. and R.I. Webb. 2011. Freeze substituion in 3 hours or less. J. Microsc. 243: 227-33. Article
Müller-Reichert, T., Hohenberg, H., O’Toole, E.T. and McDonald, K.L. 2003. Cryoimmobilization and three-dimensional visualization of C. elegans ultrastructure. J. Microsc. 212:71-80. Article
Nechipurenko, I.V., Berciu, C., Sengupta, P. and Nicastro, D. 2017. Centriolar remodeling underlies basal body maturation during ciliogenesis in C. elegans. eLife 20171;6: e25686. doi: 10.7554/eLife.25686. Article
OToole, E.T., McDonald, K.L., Mantler, J., McIntosh, J.R., Hyman, A.A. and Muller-Reichert, T. 2003. Morphologically distinct microtubule ends in the mitotic centrosome of C. elegans. J. Cell Biol. 163: 451456. Article
OToole, E.T. and Muller-Reichert, T. 2009. Electron tomography of microtubule end-morphologies in
C. elegans embryos. Meth. Mol. Biol. 545: 135144. Article
Pelletier, L., Ozlu, N., Hannak, E., Cowan, C., Habermann, B., Ruer, M., Muller-Reichert, T. and Hyman,
A.A. 2006. The C. elegans centrosomal protein SPD-2 is required for both pericentriolar material recruitment and centriole duplication. Curr. Biol. 14: 863873. Article
Redemann, S., Baumgart, J., Lindow, N., Shelley, M., Nazockdast, E., Kratz, A., Prohaska, S., Brugus, J., Frthauer, S. and T. Mller-Reichert 2017. C. elegans chromosomes connect to centrosomes by anchoring into the spindle network. Nat. Commun. 8:15288. doi: 10.1038/ncomms15288. Article
Serwas, D. and Dammermann, A. 2015. Ultrastructural analysis of C. elegans cilia. Methods Cell Biol. 129: 341-67. doi: 10.1016/bs.mcb.2015.03.014. Abstract
Serwas, D., Su, T.Y., Roessler, M., Wang, S. and Dammermann, A. 2017. Centrioles initiate cilia assembly but are dispensable for maturation and maintenance in C. elegans. J. Cell Biol. 216: 1659-1671. doi: 10.1083/jcb.201610070. Article
Silva, M., Morsci, N., Nguyen, K.C., Rizvi, A., Rongo, C., Hall, D.H. and Barr, M.M. 2017. Cell-specific α-tubulin isotype regulates ciliary microtubule ultrastructure, intraflagellar transport, and extracellular vesicle biology. Curr. Biol. 27: 968-980. doi: 10.1016/j.cub.2017.02.039. Abstract
Stigloher C., Zhan, H., Zhen, M., Richmond, J. and Bessereau, J.L. 2011. The presynaptic dense projection of the Caenorhabiditis elegans cholinergic neuromuscular junction localizes synaptic vesicles at the active zone through SYD-2/Liprin and UNC-10/RIM-dependent interactions. J. Neurosci. 31:4388-96. Article
Topalidou, I., Keller, C., Kalebic, N., Nguyen, K.C., Somhegyi, H., Politi, K.A., Heppenstall, P., Hall, D.H. and Chalfie, M. 2012. Genetically separable functions of the MEC-17 tubulin acetyltransferase affect microtubule organization.
Curr. Biol. 22:1057-65. Article
Ward, S., Thomson, J., White, J. and Brenner, S. 1975. Electron microscopical reconstruction of the anterior sensory anatomy of the nematode C. elegans. J. Comp. Neurol. 160: 313-337. Article
Ware, R.W., Crossland, K., Russell, R.L. and Clark, D.V. 1975. The nerve ring of the nematode C. elegans: Sensory input and motor output. J. Comp. Neurol. 162: 71-110. Article
White, J.G., Southgate, E., Thomson, J.N. and Brenner, S. 1986. The structure of the nervous system of the nematode C. elegans. Philos. Trans. R. Soc. Lond. Series B. Biol. Sci. 314: 1-340. Article
Winkler, H. and Taylor, K.A. 2006. Accurate marker-free alignment with simultaneous geometry determination and reconstruction of tilt series in electron tomography. Ultramicroscopy 106: 240254. Abstract

Edited for the web by Laura A. Herndon. Last revision: August 3, 2017
|