|
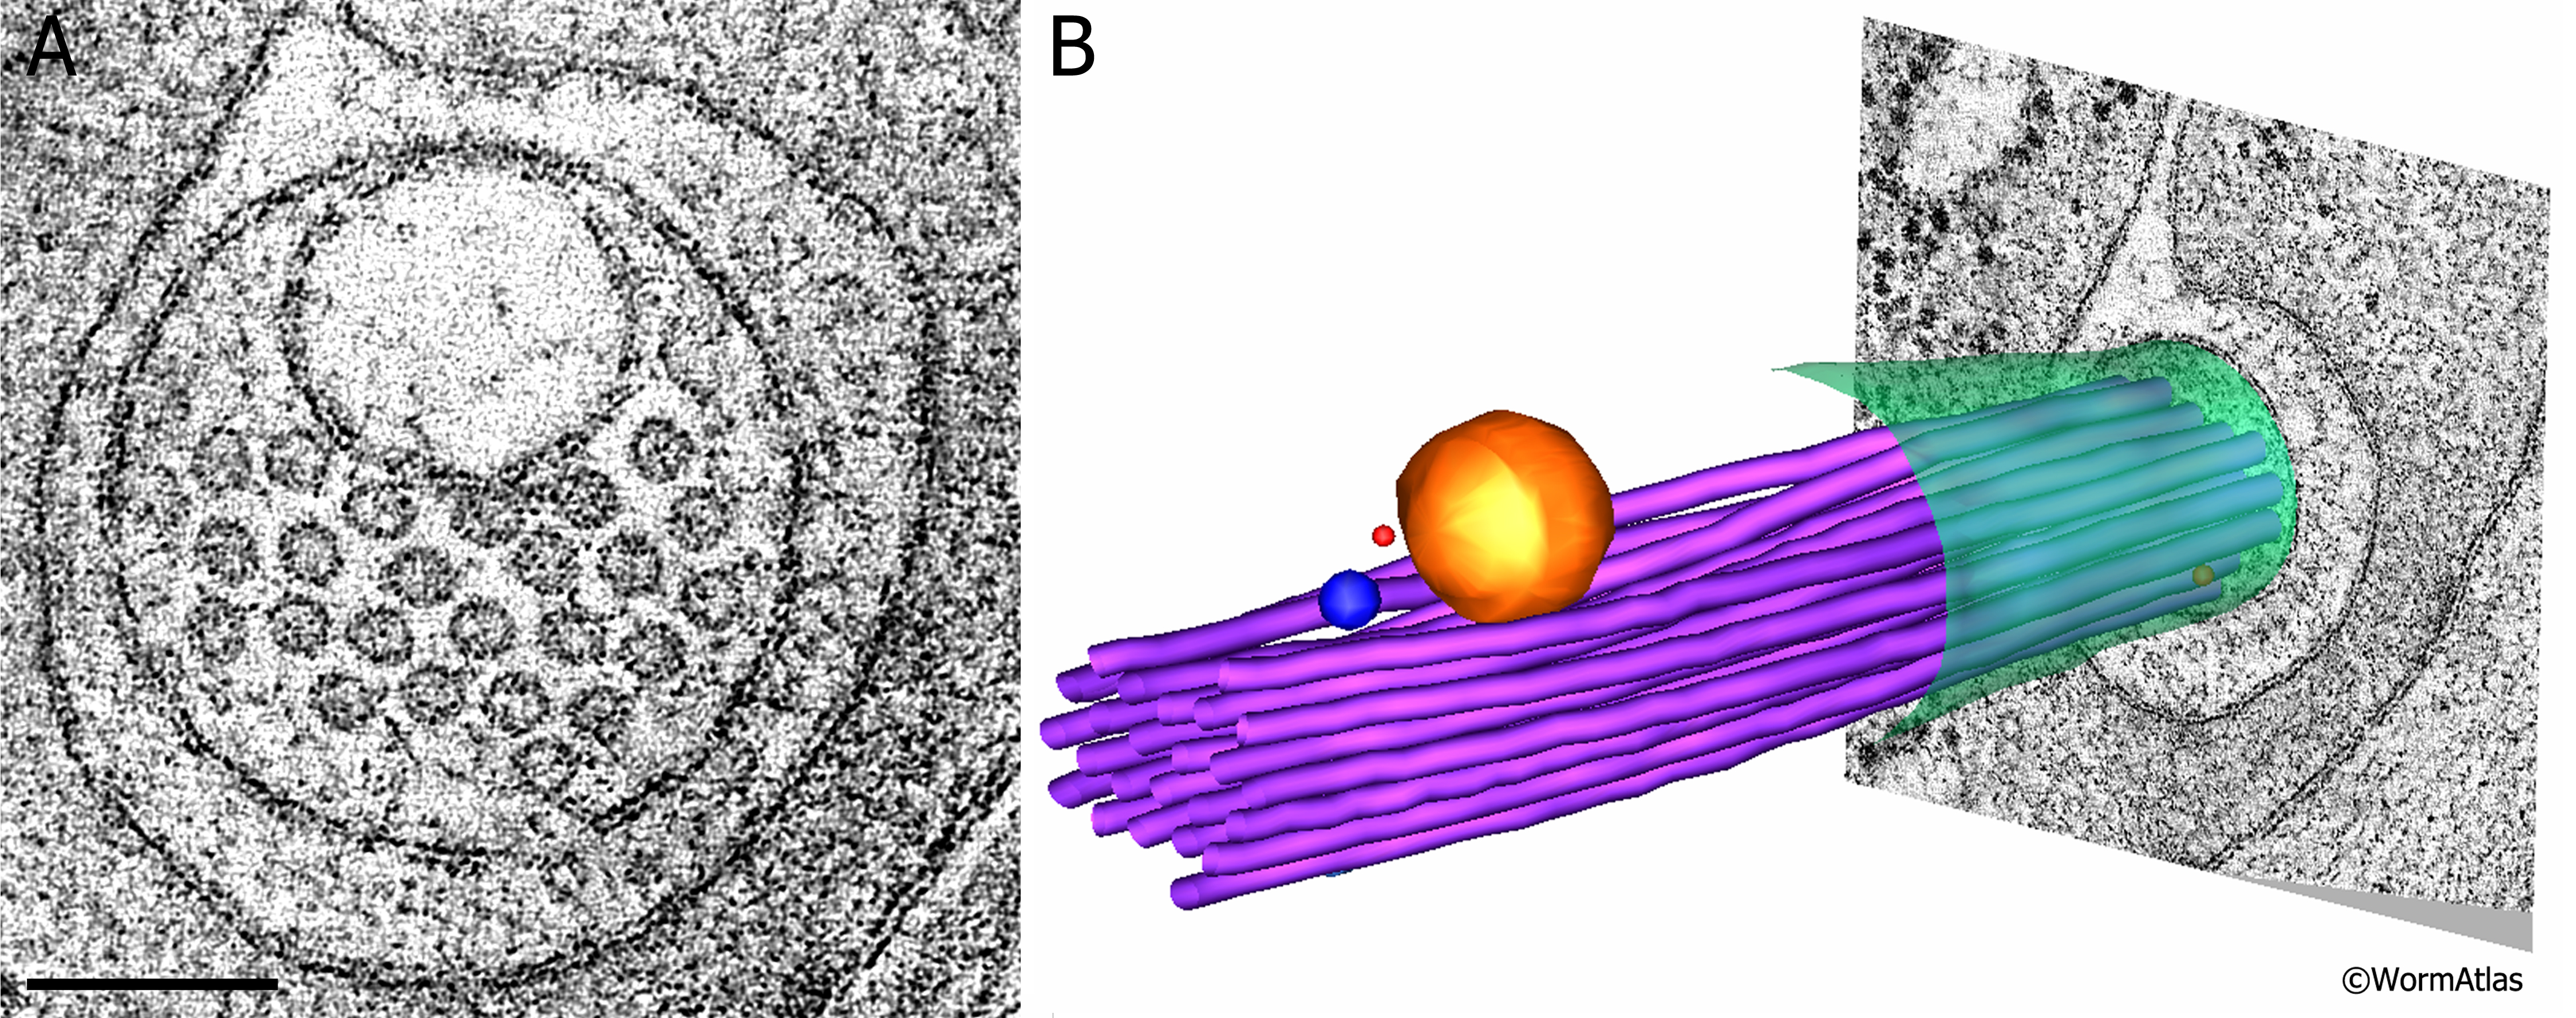
ETFIG 3: Electron tomogram of a touch dendrite.
A. Raw image of ALM dendrite within the dual axis electron tomogram, face on, prior to any annotation. This is a mathematical model built after Fourier analysis, not a micrograph. Note that the microtubules are clustered near a large vesicle, which is likely cargo to be moved by microtubule-based motors inside the dendrite. HPF/FS sample. Image capture by KD Derr (NYSBC), Technai20 TEM. Tomogram calculated using weighted back projection from internal features by Bill Rice (NYSBC). Scale bar, 100 nm.
B. Hand-annotated elements of the ALM dendrite and its neighborhood. Note that the microtubule bundle bends to accommodate passage of the vesicle. Purple, microtubules; red, ribosomes; yellow, large vesicle; blue, small vesicle; green, ALM plasma membrane. IMOD annotation by Kristin Politi.
Click on picture for full resolution image.
|