|
Computer-Based Analytical Tools
by Hall, Hartwieg and Nguyen
doi:10.3908/wormatlas.9.19
Overview
Not so long ago, every EM lab revolved around taking turns in the darkroom, a lonesome duty often assigned to the new recruits and summer students. Essential chores included developing new EM negatives by hand (2050 at a time), and printing work prints by hand for further study. Many researchers developed artistic skills in darkroom printing in order to create the perfect image for a manuscript or poster. All submitted documents involved handmade paste-ups of these perfect prints, often accompanied by large format copy negatives to capture the essence of the perfect paste-up job. A meeting poster involved assembling dozens of these perfect prints onto large panels, and which needed to be annotated by hand with Letraset lettering and arrows. Work prints were often annotated by hand with colored markers to organize the data, but color publications were prohibitively expensive. Therefore, most primary documents needed to communicate in black and white. Complex charts and diagrams were drawn by hand, using ink on vellum, which often required the work of a professional artist.
Serial reconstruction efforts revolved around the use of stacks of work prints annotated with colored pens, or cinematography, and motion picture viewing (cf. Ware and LoPresti, 1975). Since the turn of the new century, computer-based image processing has emerged as the essential replacement for all of those past procedures, and hopefully has made all of us more productive. Our previous review of TEM methods reflected that earlier era (Hall, 1995). Below we highlight some of the most useful computer-based analysis packages to emerge so far.
Computational Systems for Serial Reconstructions
There have been several recent reviews of this field (cf. Helmstaedter et al., 2008; Merchan-Perez et al., 2009; Chklovskii et al., 2010; Briggman and Bock, 2012), but it is difficult to stay up to date. Most current products require the user to carefully annotate each object in a TEM image by tracing its perimeter, which is very time consuming. In future products, it is hoped that the computer program can suggest the correct boundaries of each object in the visual field (segmentation), and that the user will only be required to recheck the computers work and correct any errors (Jurrus et al., 2009; Mishchenko, 2009; Turaga et al., 2010; Helmstadter et al., 2011; Kreshuk et al., 2011; Seyedhosseini et al., 2011). Another alternative is to simplify cell tracing to mere stick figure models of cell shapes, which can greatly speed the tracing; see the discussion of Elegance below.
One key problem with TEM datasets (besides their large image sizes) is that the typical image is subject to local distortions caused by section chatter, warping, and wrinkles in the sections themselves, and the vagaries of knife marks and staining artifacts. The SEM block-face image technique (FIB/SEM and 3View) offers one possible solution (Merchan-Perez et al., 2009; Helmstadter et al., 2008, 2011; Knott et al., 2008, 2011). Because the digital camera image typically has many fewer pixels than provided by EM film it is often necessary to stitch together many images in the plane of one section to produce a montage for each Z-plane. Distortions near the edge of the field may require the user to ignore pixels near the periphery of each image and overlap consecutive images by 1015% in order to make a reliable montage covering the desired field of view at high resolution. For instance, using a 4k x 4k CCD camera, 1016 images are required to cover one adult worm cross-section (to score synapses), or over 100 images using a 2k x 2k CCD camera. It is virtually impossible to manually collect such images without making mistakes that leave missing data somewhere in the final montage due to poor image overlap. A motorized X,Y stage on the TEM is now essential to automate these montages a feature missing on older TEMs.
New software routines for image registration, image warping, movie-making, and automated image annotation are under development in academic laboratories worldwide. It is difficult to keep up with all of these efforts, but we will feature a few here. For instance, we have used new image modification routines (the ALignTK and SWiFT-IR programs) from Art Wetzel and Greg Hood (Pittsburgh Supercomputing Center; Bock et al., 2011), and we have seen demonstrations of sophisticated annotation software from Sebastian Seung (Turaga et al., 2010) including MALIS (Maximin Affinity Learning of Image Segmentation) and BLOTC (Boundary Learning by Optimization with Topological Constraints) (Jain et al., 2010), Mitya Chklovskii (the Raveler program; Janelia Farms; Chklovskii et al., 2010), and Hanspeter Pfister (the NeuroTrace program; Jeong et al., 2010), all of which offer great promise.
Open Source Software for EM Image Analysis
As scientists continue to acquire new image data at faster and faster rates, it is becoming essential that they are able to share their data freely. The development of open source software tools has helped to foster that interchange (Swedlow and Eliceiri, 2009). Most of the following packages have emerged from academic laboratories trying to develop useful sets of tools for scientific image analysis. Many of these products have associated user groups or online list servers where one can consult experts to learn more about how to make the best use of the programs, or to suggest modifications that would improve their performance.
ImageJ (formerly NIH Image) is highly recommended. This robust set of Java-based routines is capable of handling data from many different file formats, and has a useful suite of tools for editing and analyzing new image data. It now runs on many platforms and offers a huge range of graphical output formats.
Fiji is an elaboration upon ImageJ that features many new custom functions that were designed for scientific use (Walter et al., 2010). In particular, Fiji offers image registration and segmentation tools that are important for making montages or stacks of consecutive serial section images. This software also runs on multiple platforms, including Windows, MacOS X and Linux.
TrakEM2 is a recent addition to Fiji that is specifically designed for serial section reconstruction (Saalfeld et al., 2009, 2010, 2012; Cardona et al., 2012). This may be the best alternative for general purposes in TEM image stacks. It is gaining many users, and these users are contributing new subroutines.
Axon-Tracker-3D is a semiautomated interactive software package for the tracing of axon profiles across serial thin sections (Srinivasan et al., 2010). The user must start by annotating a few profiles for each axon, after which the program attempts to automatically annotate much deeper into the image stack. Since the program is not yet ready to identify axon branch points, the user must prompt the program whenever a branch point is present.
Reconstruct is a very useful package for the analysis of serial section data from the
TEM (Fiala, 2005). This robust package
has been under development for over a decade and is relatively easy to use.
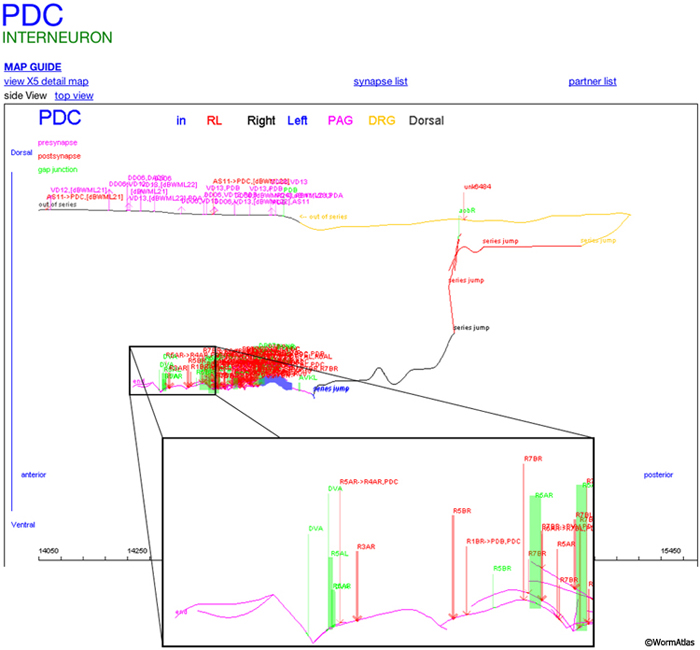
IMOD is a popular set of image analysis programs for analysis of electron tomograms that runs on Windows, Mac OS X or Linux (Kremer et al., 1996). An example of IMOD output is shown in EMComputertoolsFIG 1. The same laboratory has also developed SerialEM, which is used for TEM control during image acquisition for electron tomography, and Shape, which interfaces with IMOD to reduce noise and increase contrast in order to help to automate image segmentation within an electron tomogram. There is an active user group that discusses how to use these packages, and the authors of the software have been very responsive to questions.
 EMComputertoolsFIG 1 EMComputertoolsFIG 1
Blender can be used to create very attractive 3D models and movies based upon
serial thin section analysis from the IMOD platform (Bumbarger et al., 2006).
Elegance is a relatively new product that will be discussed in more detail below. It is designed for creating a simple wiring diagram from serial thin section TEM data, but it is not meant to produce accurate 3D graphics (Xu et al., 2013).
KNOSSOS is a new software platform for obtaining the full 3D architecture of neurons in serial thin sections, where computer analysis is used to automate the initial tracing of cell profiles (Helmstadter et al., 2011). The program offers several different modes of operation, including a skeletonization approach to trace profiles faster, and a contouring mode to obtain more exact tracing of the details of cell profiles. It has been designed to operate on a laptop, while the original data (many large image files) are stored on an external hard drive. The Helmstadter et al. (2011) paper includes a useful discussion of the substantial possibilities for errors in tracing between expert annotators, and by the automated approach to tracing.
Ilastic is a new software platform that aims to automate cell tracing in serial TEM or SEM images (Kreshuk et al., 2011). If it works for your dataset, it is time to celebrate. Here again one of the main concerns may be false connections obtained while tracing across serial images; these are discussed by Kreshuk et al (2011).
Commercial Software for EM Image Analysis
The most commonly used programs for image analysis are complex, powerful suites of analysis tools. Most are relatively expensive commercial products and they tend to have loads of special features, but one may need to buy a manual to begin figuring out how to make best use of them. While some software for image handling may come bundled with the purchase of a digital camera system, software products from the microscope vendors often have customized file formats that cripple the users ability to make the best use of their output or to share output with other users without the purchase of additional site licenses. Some of the more elaborate commercial packages still balk at working with the large datasets that emerge from serial section stacks of TEM images.
Photoshop is probably the product most widely used to create scientific images. There are several different versions available at different prices, but all of them offer
a wide range of tools for drawing and image annotation. Illustrator is a vector-based drawing program. Both are available from Adobe.
Maya is a powerful suite of tools for 3D animation, 3D modeling, and rendering available from Autodesk. It is very good for producing a raster surface over a modeled object, and for that reason it may be a useful route to enhance a model first created in IMOD.
Cinema 4D is another modular set of software tools for 3D animation and rendering, available from Maxon, with an emphasis on the speed of rendering. Some of its modules are
designed to work with datasets created in Maya. It is compatible with Windows or
Mac OS 10.4 and higher.
Amira is a rather expensive suite of tools used to manipulate and enhance scientific images. It is sold in modules that include different specialized sets of tools
designed for specific data types. Amira can handle very large datasets, but one may need to buy an extra module for that purpose. We have found it useful for making
movies from IMOD datasets.
Imaris (Bitplane Inc.) is another commonly used software package that has been under development for many years. It can handle reasonably large datasets and has
good routines for image processing, volume rendering, surface rendering, manual segmentation, and animations.
Elegance Software for Marking Neuron Branching Patterns and Synapses
When Sydney Brenner selected C. elegans as an animal model, one of his key visions was to assemble a complete wiring diagram of the animal from serial thin sections (White et al., 1986). However, the slow methods that were
available to collect images by TEM and to annotate the prints became an almost
insurmountable barrier, causing this field to stall by 1985. Elegance software has been under development for more than 10 years in the Emmons and Hall labs at
Einstein to overcome this hurdle (Xu et al., 2013). The basic principle here is to dispense with
exact tracing of cell outlines. Instead one can build simple tree-like structures for each neuron in 3D space by noting the X,Y position of each axon or dendrite
on successive electron micrographs, where the section number determines that point in space for the Z-axis. Thus, the operator can quickly mark parts of each
neuron as single points in 3D space by single mouse clicks. Elegance software
uses a similar mouse click routine to mark the position of each chemical or electrical synapse. Data generated by these mouse clicks is immediately saved
to data tables, not image files. Compared to methods that record cell shapes by
careful tracing of their outlines in EM prints, these data tables are very compact and easy to store and analyze. The Elegance package also offers simple graphics output for cell shapes including a map of synaptic contacts to/from each axon or dendrite (EMComputertoolsFIG 1), and can print out lists of all synapses involving a
single neuron. This software has been in use for 6 years among a group of active users, and their experience has helped the programmer, Meng Xu, streamline most software operations to allow the operator to work as efficiently as possible. The recent paper by Jarrell et al (2012) presents data generated using this package regarding the connectome of the adult male tail, covering all the synapses found in 10,000 TEM prints. New methods for further analysis of the connectome data are presented at the Worm Wiring website.
Helpful Hints. This software is available for free download. Basic instructions to use this package, and more examples of Elegance output can be found at the Emmons lab homepage. The software is PC based.
Figures
 Click pictures for new window with figure and legend, click again for high resolution image Click pictures for new window with figure and legend, click again for high resolution image
EMComputertoolsFIG 1: Elegance reconstruction of a neuron arbor. Side view of the male tail neuron PDC with in the preanal ganglion; inset below shows details of the synaptic contacts at higher power, from the region boxed above. Red arrows pointing toward the neurite indicate presynaptic inputs; violet arrows pointing way from the neurite indicate postsynaptic outputs. Green bars indicate gap junctions. The width of the arrow (or bar) is proportional to the number of serial sections in which the synapse could be viewed. The black axis along the bottom indicates the print numbers in the animal N2Y in which the cell could be found. PDCs cell body position is marked by a purple bar along the ventral neurite.
References
Bock, D.D., Lee, W.C., Kerlin, A.M., Andermann, M.L., Hood, G., Wetzel, A.W., Yurgenson, S., Soucy, E.R., Kim, H.S. and Reid, R.C. 2011. Network anatomy and in vivo physiology of visual cortical neurons. Nature 471: 177-82. Abstract
Briggman, K.L. and Bock, D.D. 2012. Volume electron microscopy for neuronal circuit reconstruction. Curr. Opin. Neurobiol. 22:154-61. Abstract
Bumbarger, D.J., Crum, J., Ellisman, M.H. and Baldwin, J.G. 2006. Three-dimensional reconstruction of the nose epidermal cells in the microbial feeding nematode, Acrobeles complexus (Nematoda: Rhabditida). J. Morphol. 267: 1257–1272. Abstract
Cardona, A., Saalfeld, S., Schindelin, J., Arganda-Carreras, I., Preibisch, S., Longair, M., Tomancak, P., Hartenstein, V. and Douglas, R.J. 2012. TrakEM2 software for neural circuit reconstruction. PLoS One. 7: e38011. Article
Chklovskii, D., Vitaladevuni, S. and Scheffer, L.K. 2010. Semi-automated reconstruction of neural circuits using electron microscopy. Curr Opin Neurobiol. 5: 667-75. Article
Fiala, J.C. 2005. Reconstruct: a free editor for serial section microscopy. J. Microsc. 218: 5261. Abstract
Hall, D.H. 1995. Electron microscopy and three-dimensional image reconstruction. Methods Cell Biol. 48: 395-436. Abstract
Hall, D.H., Hartweig, E. and Nguyen, K.C.Q. 2012. Modern electron microscopy methods for C. elegans. Methods Cell Biol. 107: 93-149. Abstract
Helmstaedter, M., Briggman, K.L. and Denk, W. 2008. 3D structural imaging of the brain with photons and electrons. Curr. Opin. Neurobiol. 18: 633641. Abstract
Helmstaedter, M., Briggman, K.L. and Denk, W. 2011. High-accuracy neurite reconstruction for high-throughput neuroanatomy. Nature Neurosci. 14: 10811088. Abstract
Jain, V., Bollmann, B., Richardson, M., Berger, D.R., Helmstaedter, M.N., Briggman, K.L., Denk, W., Bowden, J.B., Mendenhall, J.M., Abraham, W.C., Harris, K.M., Kasthuri, N., Hayworth, K.J., Schalek, R., Tapia, J.C., Lichtman, J.W. and Seung, H.S. 2010. Boundary learning by optimization with topological constraints. CVPR, 2010 IEEE Conference. 2488-95. Abstract
Jarrell, T.A., Wang, Y., Bloniarz, A.E., Brittin, C.A., Xu, M., Thomson, J.N., Albertson, D.G., Hall, D.H. and Emmons, S.W. 2012. The connectome of a decision making neuronal network. Science 337: 437-444. Article
Jeong, W.-K., Beyer, J., Hadwiger, M., Blue, R., Law, C., Vazquez-Reina, A., Reid, R. C., Lichtman, J. and Pfister, H. 2010. Secrett and NeuroTrace: Interactive visualization and analysis tools for large-scale neuroscience data sets. IEEE Comp. Graph. Appl. 30: 5870. Article
Jurrus, E., Hardy, M., Tasdizen, T., Fletcher, P.T., Koshevoy, P., Chien, C.B., Denk, W. and Whitaker, R. 2009. Axon tracking in serial block-face scanning electron microscopy. Med. Image Anal. 13: 180188. Abstract Article
Knott, G., Marchman, H., Wall, D. and Lich, B. 2008. Serial section scanning electron microscopy of adult brain tissue using focused ion beam milling. J. Neurosci. 28: 295964. Article
Knott, G., Rosset, S. and Cantonil, M. 2011. Focussed ion beam milling and scanning electron microscopy of brain tissue. J. Vis. Exp.53: e2588. Article and Video
Kremer, J.R., Mastronarde, D.N. and McIntosh, J.R. 1996. Computer Visualization of Three-Dimensional Image Data Using IMODJ. Struct. Biol. 116: 7176. Abstract
Kreshuk, A., Straehle, C.N., Sommer, C., Koethe, U., Cantoni, M., Knott, G. and Hamprecht, F.A. 2011. Automated detection and segmentation of synaptic contacts in nearly isotropic serial electron microscopy images. PLoS One. 6: e24899. Article
Merchan-Perez, A., Rodriguez, J.R., Alonso-Nanclares, L., Schertel, A. and Deflipe, J. 2009. Counting synapses using FIB/SEM microscopy: a true revolution for ultrastructural volume reconstruction. Front. Neuroanat. 3: 18. Article
Mishchenko, Y. 2009. Automation of 3D reconstruction of neural tissue from large volume of conventional serial section transmission electron micrographs. J. Neurosci. Meth. 176: 276279. Article
Saalfeld, S., Cardona, P., Tomancak, P. and Hartenstein, V. 2009. CATMAID: Collaborative annotation toolkit for massive amounts of image data. Bioinformatics 25: 19841986. Article Info
Saalfeld, S., Cardona, P., Hartenstein, V. and Tomancak, P. 2010. As-rigid-as-possible mosaicking and serial section registration of large ssTEM datasets. Bioinformatics 26: 5763. Article
Saalfeld, S., Fetter, R., Cardona, A. and Tomancak, P. 2012. Elastic volume reconstruction from series of ultra-thin microscopy sections. Nat. Methods 9: 717-20. Abstract
Seyedhosseini, M., Kumar, R., Jurrus, E., Giuly, R., Ellisman, M., Pfister, H. and Tasdizen, T. 2011. Detection of neuron membranes in electron microscopy images using multi-scale context and radon-like features. Med. Image Comput. Comput. Assist. Interv. 14: 670-7. Article
Srinivasan, R., Li, Q., Zhou, X., Lu, J., Lichtman, J. and Wong, S.T.C. 2010. Reconstruction of the neuromuscular junction connectome. Bioinformatics. 26: i64i70. Article
Swedlow, J.R. and Eliceiri, K.W. 2009. Open source bioimage informatics for cell biology. Trends Cell Biol. 19: 656660. Article
Turaga, S.C., Murray, J.F., Jain, V., Roth, F., Helmstaedter, M., Briggman, K., Denk, W. and Seung, H.S. 2010. Convolutional networks can learn to generate affinity graphs for image segmentation. Neural. Comput. 22: 511538. Article
Walter, T., Shattuck, D.W., Baldock, R., Bastin, M.E., Carpenter, A.E., Duce, S., Ellenberg, J., Fraser, A., Hamilton, N., Pieper, S., Ragan, M.A., Schneider, J.E., Tomancak, P. and Hee, J.-K. 2010. Visualization of image data from cells to organisms. Nat. Meth. 7: S26-41. Abstract
Ware, R.W. and LoPresti, V. 1975. Three-dimensional reconstruction from serial sections. Int. Rev. Cytol. 40: 325440. Abstract
White, J.G., Southgate, E., Thomson, J.N. and Brenner, S. 1986. The structure of the nervous system of the nematode C. elegans. Philos. Trans. R. Soc. Lond. Series B. Biol. Sci. 314: 1-340. Article
Xu, M., Jarrell, T.A., Wang, Y., Cook, S.J., Hall, D.H. and Emmons, S.W. 2013. Computer assisted assembly of connectomes from electron micrographs: Application to Caenorhabditis elegans. PLoSONE 8: e54050. Article
|